
When it comes to the art and science of trading financial markets like Forex, stocks, or crypto, there are some skills that very few people seem to ever catch on to or even know about and one of them is regarding in technical analysis how to tell the difference between a pullback and a reversal.
What exactly do I mean by that?
When a trend is going in one direction and then it retraces or corrects and then continues in the same direction versus when a trend completely ends how do you tell the difference? Why is that so mysterious to almost all traders and yet it seems like it’s so fundamental to chart reading skills that every trader would most need to know when it comes to reading charts of financial markets like Forex currency pairs and crypto.
Knowing the difference between a pullback and a reversal is a critical technical analysis chart reading skill. I can show you this live or in a demonstration video. Let’s take a look and you tell me if you notice what I am talking about.
So many traders are looking at charts and one thing that they often do is to enter trades in the opposite direction of the trend when the market begins to retrace a bit they’ll focus on that retracement as being a trading opportunity. And then they’ll get wiped out as the market continues the trend.
Another common thing that you see traders do is they will look at a chart that has a trend already formed. Keep in mind whenever you SEE a trend the reason is because it ALREADY formed in the past and is likely to end. That’s why traders will go along the top of a trend or go short at the bottom of a trend.
Another thing many traders experience is they get out of trades long before the market is actually turning, throwing away a lot of potential profit that they could have had if they knew what the market was doing.
A lot of people exit a trade when it reaches an average daily range which, as I can show you, is really the most pointless thing that a person could do, because when you choose to enter a trade at the beginning of a trend it will begin forming a trend. And it will go past the average daily range because an average includes corrective days when the average is lower. So if you’re just not knowing whether it’s a trend or correction you’re just hoping for an average. That means you don’t even know what the market is doing. For proficient chart reading traders, the reason for entering a trade is defined by the signals that show a new trend is forming and it will definitely go past the average daily range.
Have you noticed price action traders, exiting a portion of their trades almost immediately when “target 1” is hit? What is the reason for these targets? These are groping guesses of traders who have no idea that it is visually shown in several ways when a market will continue and when it will turn.
When you enter a trade, you often see what looks like a beginning of a trend and a strong impulsive move and then they get in after it has formed only to see it reverse and continue the previous direction that it was going before. How could you tell that was about to happen? How is it that some traders can enter right at the beginning of a trend and then just stay in and be calm and relaxed, knowing what it’s doing and then exit at the end of the trend? Could it be from some simple chart reading skills? How is it that some traders could do that and some traders have no idea how to do that? And why is that concept different from “trend following”? What we’re doing is we’re identifying a specific point where a trend is beginning. Not only can anyone learn to identify the very beginning of a trend my question is, how is it that anyone WOULD NOT be able to see this?
I can see how that may seem to be mysterious if you aren’t familiar with how to read charts and you’re not familiar with how to read the larger picture and how to use known patterns on all time frames and subdivisions which form a roadmap that tells you how you would trade on every time frame. Let’s take a look and see how this works for yourself.
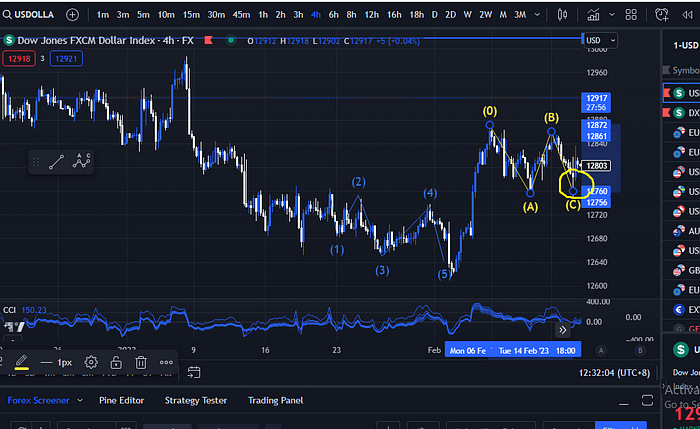
If I look at the right side of this chart and this is in the past and obviously what I’m showing you has nothing to do with hindsight. I’m showing you the theory of how you can recognize entries and exits right at the point that they form. And that’s what we do every day in our live sessions in real time seeing the entries BEFORE they form.
So if you look at this chart above, this is a place where an entry signal is known and recognized. Right there where the yellow circle is drawn, you can see that is an entry. Now if you don’t know that that’s an entry signal that’s okay. You can learn how to recognize it. It’s a very specific thing that’s different from anything else. We don’t think that there’s entry signals other places. We don’t confuse that there’s an entry signal somewhere else. There’s just that one. And once you enter you will get profit if you know how to recognize that.
So if you’re following what I’m showing you, just relax and it’s okay if you don’t know why that is or if you think that you can only see that in hindsight. That’s okay. You may not yet recognize it. But you can learn it.
Now once you enter at a recognized end of correction then you would soon discover that you would have profit. The first problem is, most people don’t know that’s an entry. They wouldn’t be able to enter there. But if you do enter there and then it starts to move, a lot of people would think, “Oh I should get out now.” Because they wouldn’t know that it’s going to keep going. That’s because they don’t know how to determine that even though it can be seen to a fairly accurate degree with some visual recognition and a little skill. Just believe that some traders can know if it’s going to turn or not and that the market does show that.
If you know how to recognize it, so that every time this happens you will get in and have a high probability of ending up with profit. If a trader gets in there and they just get out for no reason, they just lost a bunch of potential profit that they could have had if they stayed in. Imagine what happens if you know that it would keep going.
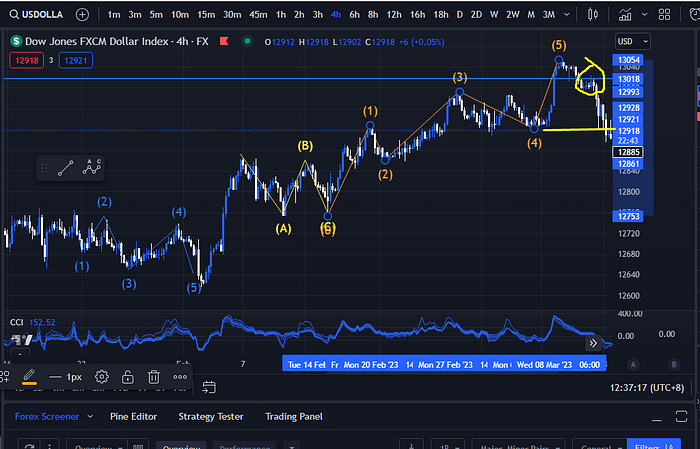
So here this is not finished going up even when it is here when it gets to here are you worried that it might reverse. If you’re looking at this right now when you think oh I must be really really lucky if I stayed in to the top of that. And now it’s reversing how would you know if it’s reversing or it’s going to continue? Well if you know how to read the chart you would instantly look at that and say no that’s not going to reverse there’s no question about it. Then it keeps going and it makes a pattern that the market keeps making every single day. And this is interesting that I have seen groups of professionals in the financial industry who all together believe that there is no way that anything in technical analysis can tell anyone why they would need to enter a trade and they believe that it’s just purely random and there’s nothing that you can tell from using any kind of technical analysis.
When I hear people say that, on one level I love to hear people say that because it makes it seem like if you can tell that you must be super human with extraordinarily rare skills. If I can tell that, it makes me feel like I must be really extraordinary but in my mind also I think yeah that’s really sad how could a person could be that ignorant and blind. Because I could take a chart and show them something like this and say have you ever seen this pattern here? Did you see that pattern? If it’s true that they believe that the market is just completely random they would have to say, “No I’ve never seen that pattern before.” Well what about over here it did the same thing and then what about the hundreds and thousands of times that it does the exact same thing every day you never saw that before? I see it every day of my life! How could you not see it? The market continually forms the end of a correction. How can you not see that? When you don’t get out of the trend because you can recognize that there’s no turning point, there’s no exit. And that just means you could easily make a lot more profit because it keeps going. And keeps going, keeps going, and still keeps going. And there are some people who can tell what that’s doing. Knowing the art and science of reading charts.
To be able to recognize one specific point where the market turns and ends is the basic skill of reading charts. Most people don’t know that you can do that. That’s why it’s so valuable to participate in our live sessions. Because if there are so many people who do not know that its possible to do and then they’re going to learn for themselves how to do it that enables you to really gain an incredibly valuable skill. Something that really helps in trading because if you want to have profit and training what is it you’re trying to do know when to buy and when to sell or Visual Signals let’s say you actually learn how to read financial markets.
Then you become very selective about when and why you would enter a trade you look at this chart right here and you could instantly recognize that there is an entry signal on that chart now. If you don’t know there’s an entry signal there and just assume that you could know and that there is something there that you could learn to recognize. If there is some specific thing that is there that you can learn to visually recognize that that is an entry signal and not to be confused with anything else. Because you know how to read when there’s impulsive price action and corrective price section. And it forms a pattern. So let’s say you did enter there and then right here you would think oh I need to get out. A lot of traders would think that because they don’t know what that is and everything they believe is just random, so they don’t know and the market is just going to turn and go back up. But once you realize that there is a specific thing that keeps happening that CAN be read with the eyes, it’s a visual thing you can recognize. You will think, “Here it comes again! There it is!”
Soon you could recognize that and know and you could look at that be able to relax and confidently stay in. Then it just keeps going and there’s no accident and it keeps on going.
Well what about when you saw this point right here? I think now it has turned and I should exit and then it just keeps going until this point and that there’s one point right there that could specifically be identified. And it’s not because of measuring something or Fibonacci or target ranges or something like that. It’s not because of supply and demand ranges or something like that. It’s a specific visual thing that some people could just look at as we do and just recognize, “Oh there it is! There’s the point.”
You need to know if you have that ability. This to me is basic chart reading ability. It seems, based on what other people are doing, as being some extraordinary skill. It’s really just basic chart reading skills. So don’t worry if you watch one Youtube video and I show you the exact entry point. You know there it is right there. Its ok if you don’t fully understand you can’t go away just start trading independently and do nothing but win every single time. But just know that there is more to learn and assume that there is more than what i am able to demonstrate and communicate to you right here in this article. There’s more you would need to be able to apply because once people do accept that the market does form patterns, then they might look at a chart and think. “Well I can kind of see a pattern over here but over here it just seems like chaos. Over here I don’t know what that is because there are additional steps. Yes if you just took one chart of one currency pair and looked at one time frame that you chose randomly this time for you to look at it depending on how your charts are set up and how the display is set up, you would need to do some additional steps in order to see the entire picture. And know these things it’s not too much to expect that a person would need to take a couple of extra steps in order to be able to see the entire picture and know when the market and when to exit a trade.
If you’d like to know more about how this can actually be done in a trading business just join us in our live sessions which we have every day. There is a free course that you can get started enrolling at: