When I first heard about what are known as “chart patterns”, I found out that this knowledge, at the beginning, was taught as basic technical analysis. This was taught as “Dow Jones Chart Reading”, which is kind of the standard for what I would consider to be “old-school professional trading”. Now, if you ask some Forex traders or some crypto traders if they know about chart patterns, they will say, “Oh yeah. I learned about that in the “Forex Alien Annihilator System”.
A lot of traders don’t really know anything about the history of the subject of technical analysis, and reading charts for trading financial markets at all. If you want to know how to make winning trades using proven visual chart signals let’s get started with that and make it happen right now.
In this day and age, how does an average Forex trader or crypto trader know about knowledge that has a history? And has been used for a long time before there ever was crypto trading, and actually for a long time before there ever was retail online Forex trading? Well there are many books and seminars on the subject but a lot of the knowledge that is known and proven for many decades is in the book Technical Analysis of Stock Trends by Edwards and Magee.

This knowledge has been taught to professional traders of all levels. Things like the “head and shoulders”, “pennants”, “double and triple tops and bottoms” and so on. These are visual signals that are based on known market behavior patterns. The Edwards and the Magee is a massive tome and it’s like the authority and textbook for traders who are studying to get their Chartered Market Technician certification. And it is a known thing that has been used in the financial markets, especially in the U.S. on Wall Street and in Chicago for a long time.
So if you’re an engineer and you like studying all this technical analysis stuff, that could keep you busy. But if you actually want to learn how to trade, you probably want to look at a chart and have someone show you what it is that you’re supposed to look for, which can be done without reading anything. You can just look at it and see.
For instance having someone demonstrate, “Here’s the reason why you would enter a trade” and “Here’s the reason why you exit a trade”. And then you practice that. Discover through observation and testing, that what you know is true. Do it over and over again. And be able to master trading.
Is there a way that a person could just look at a chart and instantly know what would be the visual technical signal for any next trade for an entry or an exit? And also know if a market is going to continue in the same direction or if it’s going to turn? These things have been discovered to be true by me and other people. Discoveries like you can look at a chart and tell just that, whether it’s going to continue in the same direction or if it’s going to turn.
What are the visual and technical signs that show if a market is going to turn or reverse? And do markets actually reverse, or do they change directions for a period of time forming a correction and keep going the same direction and so on. In our live sessions that is exactly what I teach traders to do based on what I have experienced. I will show you how to avoid a lot of wasted time and how to learn some things that are known to be true about what you can actually use as trading decisions without having a long period of trial and error as I did. In many cases, making mistakes that I would prefer not to make, and then doing it over and over until I finally realized things.
Anything that I have finally realized to be true, I want to show people right up front, “Just look for this”. “Don’t waste your time thinking that this is what’s going to happen. When in fact, you can see for yourself and test it out that this is how the market behaves’.
When it comes to Forex and even crypto, you can learn which are the pairs or the instruments to focus on and what are the time frames where patterns can be recognized and seen? And what is the actual way in the process to plan and enter a trade that has a high probability of becoming a winning trade? So let’s take a look at that.
Interestingly, when I looked in the beginning of the book by Edwards and Magee, I discovered that it was mentioned that Robert Prechter, founder of Elliott Wave International, had given a talk on technical analysis, and it was mentioned that they all agree. Because the people who are on the side of reading charts using technical analysis may have a conflict on the other side of this debate, that you can look at charts and only use fundamental analysis and economic data. So even though the two types of chart patterns of Dow Jones Chart Patterns and Elliott Wave Patterns are very different, I thought it was quite amazing that they even mentioned this and included the Elliott Wave expert.
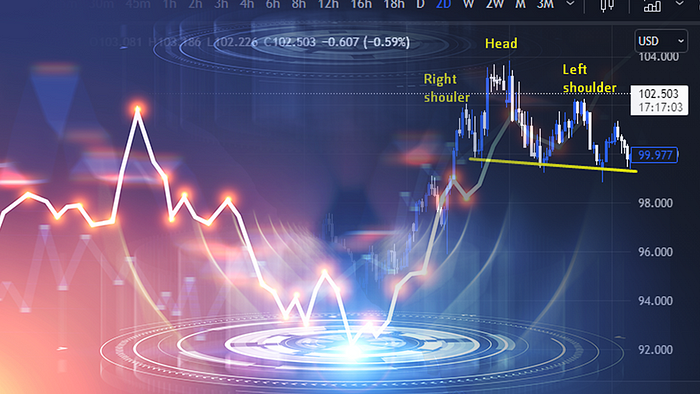
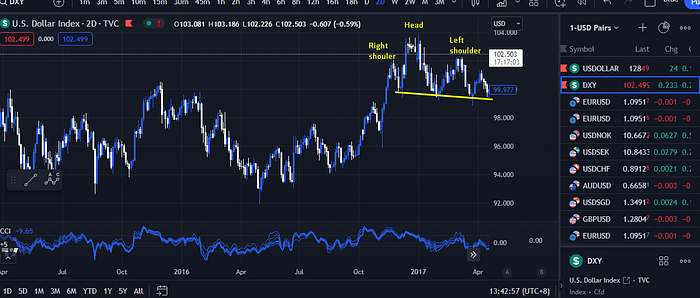
Have you heard of the pattern, the “head and shoulders”? If you have seen this pattern and if you are familiar with the natural known patterns of trends and corrections that are known through Elliott Wave, then you know that basically it means that there was a high, then there was a higher high, then there was a lower high. And it’s taught that it’s a reversal signal.
But what we know is that every trend has a similar thing that happens. The high of wave 3 followed by the high of wave 5 followed by a lower high usually of wave B. And then it doesn’t reverse. It forms a correction and keeps going.
What is significant is to recognize what that pattern is in the context of whether it’s a trend and whether it is a correction to a trend.
Triangles are another thing that are a known natural phenomenon that occur in financial markets. And when they happen it has a meaning that can be read by someone who knows how to read charts. There are different types of triangles and they usually represent a simple correction to a trend. It’s normal for there to be trends and corrections. During certain types of corrections to a trend, the market begins to move into the pattern known as a triangle. As soon as the clues occur at the very beginning of a triangle, if you’re very used to reading charts, right from the very first wave you can see, “Oh this is going to become a triangle.”
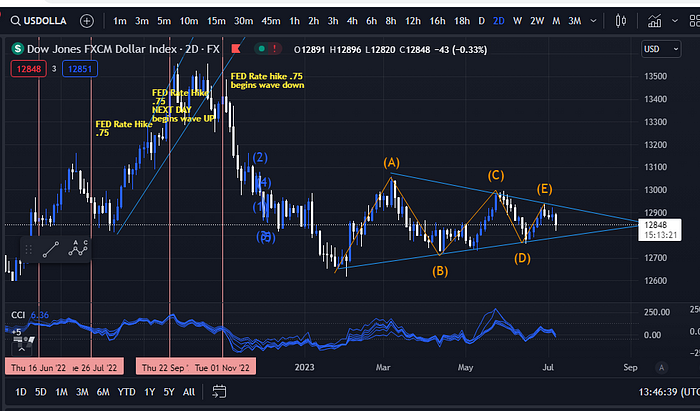
But in many cases you don’t know until after a triangle has formed. Then you begin to see what it is. “This is a triangle”. And how should it be traded? As we saw here on the dollar index, the forming of a triangle and the breaking and retesting of the triangle line is very significant for telling traders where the likely direction that the market is going to go in the future.
The old “double and triple top” idea is a pattern that obviously has some significance but it may have a lot more significance if you can read other patterns and see it in the context of that. When does it have a significance? When the market hits a certain high multiple times how do you know it’s going to be a double, triple, quadruple top? And what is the significance of how would you use that for trading? Certainly, you could look at it and notice it might hit this high and how many times? But how many times did I enter a trade and then lose and it didn’t keep going, versus how many times did I identify a specific type of pattern to a high probability trade that will work in the future? And has it been known to work in the past?
Adjusting the Frequency: The Key to Reading Patterns.
All patterns can be read with a higher degree of accuracy by adjusting the time frames up and down and by zooming in and out in order to view larger patterns that the pattern that you’re looking at, is a part of. And smaller patterns that make up the pattern that you are looking at. This will become so obvious to any trader who is really interested in reading the market and understanding what it does. Then it will just become second nature to you after some time looking at charts and reading.
Do you know how to instantly recognize an ABC correction, which isn’t a part of Dow Jones chart patterns? And do you know why this particular pattern isn’t likely to be confused with any other pattern? How do you identify the end of an ABC so that you can have a very high probability entry that works out? Something that will guarantee you more profit than is possible using any proprietary indicator, software, algorithm, any trading strategy or trading system?
Once any person has stepped through the door of being able to read financial markets at a higher level using some version of Elliott Wave and having some type of breakthrough that enables them to be able to start seeing these patterns, these methods like Dow Jones Charts Patterns, support resistance will seem to be very crude and ineffective.
Does Elliott Wave Theory Allow Full Market Reversals?
Here’s another interesting thing regarding the concept of Elliott Wave, is that many people believe that the theory of Elliott Wave doesn’t allow market reversals. I have people who said this in Elliott Wave. It just keeps on forming trends and corrections and keeps on going. This concept comes from an ignorance of the basics of Elliott Wave because the very basics of subdivisions and Elliott Wave teaches us that every normal pattern that’s formed in the market has a reversal of a trend embedded right in it. And that is because every trend that is a wave 5 will be followed by a complete reversal of 100% of that trend. And every trend that is a wave C will be followed by a reversal.
If you ever see a reversal on any time frame all you do is go to the longer time frame, notice that’s a wave 5. Just notice what is forming and is what it’s actually doing on the longer time frame. Make sure you caught that and if you need it repeated, I can show it to you. Watch the video twice and look at the illustration and once you get it, you will never stop knowing that.
The way to trade any financial markets is to be able to read the charts and recognize known, proven patterns. The more we learn about patterns, the more likely it is that we begin to make trading decisions that work out. This is barely the beginning of this subject and if you would like to learn more about what is really known to work in trading just go to tradingmastermind.com and you’ll see there that we offer a free course to traders. That’s what I give people to help people to be able to make some progress that leads to their being able to read charts and make profitable trading decisions. There are over 40 videos in this trading program that I give out for free, so just sign up and you’ll be on your way to making profitable trading decisions on a regular basis.
Watch the entire video demonstration here: