Today, I’m about to reveal the most confidential hidden gems of trading with supply and demand that you won’t find anywhere else. Get ready for a groundbreaking journey that will transform your trading results like never before!
Picture this: as you dive into this article and accompanying video, brace yourself for powerful breakthroughs that will revolutionize the way you approach trading. I guarantee it!
The ultimate goal is simple: more winning trades and a growing account balance. Let’s kickstart that journey right away. As you follow this demonstration and watch the video, prepare for those “aha” moments that are just around the corner. Show your appreciation by giving a round of applause, as this level of training comes to you absolutely free!

Now, let’s delve into the core concept of supply and demand in trading. When the price rises, it’s a clear sign of increasing demand, while a drop in price indicates an excess of supply relative to demand. Sounds straightforward, right? But here’s the kicker — merely knowing this won’t help you predict market turns or the duration of a trend. It’s just the tip of the iceberg. However, fear not! There are other visually engaging and technically insightful indicators that can offer those crucial insights.
So, are you ready to uncover the hidden patterns and secret strategies that will empower your trading game? Let’s explore together and unlock the true potential of supply and demand trading! Remember, these valuable insights are exclusive to this article and video, so get ready for a game-changing experience.
How Can You Know When the Market is Turning?
In the world of trading, one would expect certain fundamentals to be crystal clear. Yet, we often find ourselves grappling with the age-old questions: How can we predict if the market will retrace and continue its course, or reverse entirely? When do we enter and exit a trade? Is it all just guesswork, akin to flipping a coin? Well, let’s embark on a journey to unravel these mysteries and gain a deeper understanding of the art of trading.
The burning question remains: Can we truly know when the market is turning? Is there a way to spot these crucial moments with precision? As intuitive as it may sound, the fact that the market goes up due to increased demand and down due to heightened supply doesn’t fully equip us with the insights we need. So, what’s the secret to successful supply and demand trading? Is it all about relying on probabilities based on historical data?
Many experts argue that supply and demand trading is distinct from the concept of support and resistance. However, it seems that some merely advocate the use of “supply and demand” as a brand name, adding a hint of authority to the approach. Whether you choose to call it one term or another, what truly matters is how effective it is in helping us trade and make money.

What is the Connection With Imagined Concepts Related to “Who is on the Other Side of the Trade?
Now, here’s a crucial insight I’ve discovered: By understanding the role of supply and demand in market movements and using terminologies like “institutional traders,” “retail traders,” “order flow,” or “bankers,” a subtle assumption is made. It presupposes that the trading method known as “supply and demand trading” imparts a special ability to identify turning points in the market and trade alongside institutional players.
So, let’s set forth on this journey of exploration, armed with knowledge and a thirst for understanding. We’ll uncover the truth behind supply and demand trading and its potential to give us that edge we seek. Get ready to take your trading game to the next level!
When you come across the so-called “supply and demand trading” method, it won’t take long to realize how perplexingly clueless the experts seem in identifying regular turning points in the market. Does this knowledge truly bestow some special ability to predict market turns? Are these trading zones even capable of pinpointing true supply and demand?
So, how can you accurately determine changes in the supply and demand of a currency pair or any financial equity? Allow me to introduce you to the essence of true supply and demand trading. The way I’ve always traded is rooted in authentic supply and demand principles. Unlike many, you’ll notice I don’t rely on these drawn zones on my charts. Sure, you can use them to some extent, but they fall short in identifying real changes in supply and demand. My probability of nailing those precise turning points is substantially higher than any trader employing the supply and demand trading method. Don’t believe me? Let’s put it to the test!
The scientific truth I’ve unearthed through years of research and market observation is critical to understanding this approach. The catch lies in making certain steps to enhance the visibility of these recognized visual criteria on your charts. Sadly, most people miss these crucial details because their charts aren’t adjusted properly. But don’t fret; I’ll show you exactly what to look for.
Surprisingly, many people are unaware of how to spot these turning points, and some even doubt the possibility of doing so. Consequently, they don’t actively seek them out. However, I assure you that these actual turning points may or may not coincide with previous supply and demand zones. It’s essential to open your mind to the reality that these critical turning points often occur in unexpected places.

Are you ready to see this in action? Take a look at the charts for yourself, and you’ll witness the undeniable truth right before your eyes. Today is the day to challenge conventional beliefs and unlock the secrets of true supply and demand trading!
Are you ready to witness the undeniable truth and trade with confidence based on your newfound knowledge? For me, those zones from the past hold little significance. Instead, I’ve honed the ability to identify genuine supply and demand turning points with remarkable accuracy and probability. The beauty lies in its visual nature — these real turning points often stand out boldly, clear as day. Not only can they be identified in advance, but they can also be spotted in real-time as they unfold. All of this, achieved through visual analysis, sometimes effortlessly, and occasionally with a few additional steps.
Now, let’s not dismiss the fact that the market does, at times, exhibit turns around previous supply and demand zones. While this may offer a bit more probability, it’s crucial to understand that it’s not the definitive method for determining these turning points. To truly grasp this concept, take a look at a chart. That’s precisely how I came to know the undeniable truth.
So, are you intrigued to explore this groundbreaking approach? Prepare to witness the magic of true supply and demand trading, empowering you to spot those game-changing turning points with certainty! Let’s dive in and unlock the secrets that will revolutionize the way you trade forever. Are you up for the challenge?
Trend vs Correction
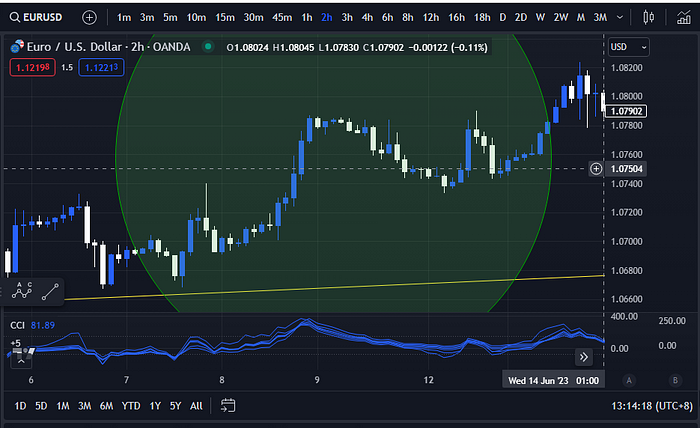
Alright, let’s dive into the fascinating world of trends and corrections in the financial markets. It’s quite intriguing how we can spot trends and corrections on any chart, for any currency pair, and on any time frame. The key lies in recognizing a distinct shape, rather than simply counting waves. So, let’s unveil the secrets of identifying trends and corrections visually on a chart.
Picture this: in an uptrend, we see higher highs and higher lows without any overlapping waves. Conversely, a downtrend correction comprises higher highs and higher lows that do form overlapping waves. But there’s more to it than meets the eye. If you’re into trading financial markets, with the right guidance and knowledge, recognizing trends and corrections on a chart becomes crystal clear right from the start.
That part? That’s the trend.
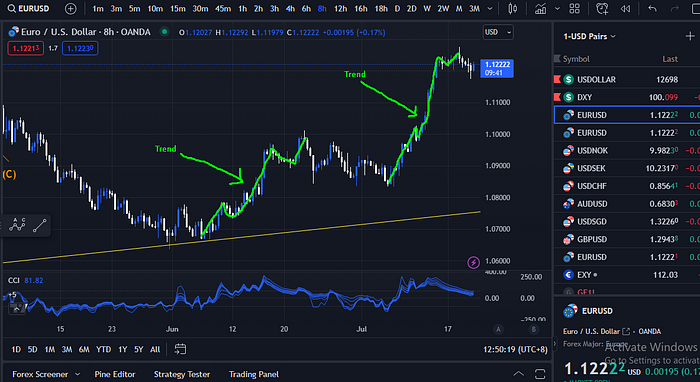
This part? That’s the correction.
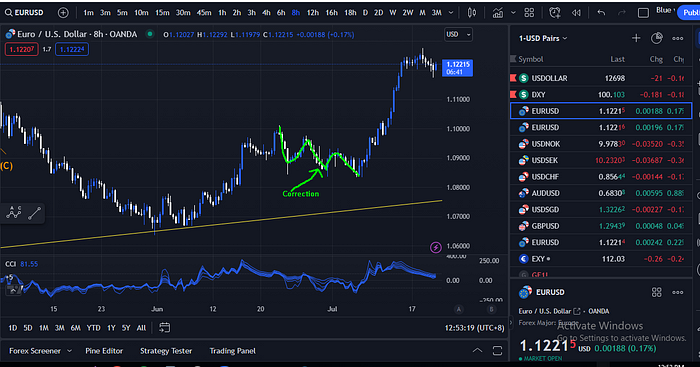
It’s as clear as day, and understanding these two distinct psychological and supply and demand behaviors of the market is crucial.
Just like recognizing a horse or a table based on their unique shapes, identifying trends and corrections becomes second nature. A trend keeps going through all supply and demand, not stopping for anything, while a correction often ends at a location far from previous support or resistance. It’s all about observing these recognizable shapes and understanding the nuances of price action.
Now, here’s the exciting part — due to the known observation of “wave subdivisions” during a correction on a shorter time frame, there might be trends heading down on that same shorter frame. These corrections come with clear and identifiable shapes, making it relatively easy to spot the end of a correction.
Interestingly, there are naysayers who deny the existence of these formations, but rest assured, I’ve conducted laboratory testing and found that these trends indeed form on all charts. Who would have thought it was possible? No need to be an Elliott Wave believer — they’re present across the board. You just need to adjust your charts to find the right time frame and currency pair.
While some may claim Elliott Wave doesn’t work, it’s almost like a compliment to me. It means the skill I possess is quite rare and coveted. However, I believe that anyone can learn to identify the end of a trend and correction, which holds tremendous value for traders. Knowing when to enter and exit a trade can make all the difference.
Now, it’s time to unravel the truth about the financial market. What is it really doing? Let’s dive deep and discover the scientific truth that will empower us to navigate this complex world of trading. Are you ready for this enlightening journey?
Let me reveal to you the undeniable truth about the market — it forms distinct, recognizable trends, followed by equally recognizable corrections. It’s as simple as that. However, the majority of people struggle to trade effectively. They can’t spot the end of a trend or correction, and even seasoned professionals might falter in this regard. So, it’s no surprise that most would doubt the effectiveness of my trading approach and the remarkable results it yields.
But I invite you to witness this truth firsthand. Seeing is believing, right? When you enter trades and consistently profit, that truth becomes ingrained in your understanding. It doesn’t matter what naysayers claim; their skepticism only fuels my gratitude for having the ability to see and do what others might find elusive. I truly believe that with a little guidance and knowledge of what to look for, anyone can master this art.
The key lies in recognizing the end of a trend and the end of a correction. That’s where the magic of true supply and demand lies. In an uptrend, the end of the trend signifies supply, not some random point in the past. Similarly, in a downtrend, the end of the downtrend indicates demand, while the end of a correction in a downtrend represents supply — there’s no doubt about it.
Now, brace yourself for an eye-opening experience. I’ll show you more, and you’ll witness firsthand just how true and effective this approach is. The pattern the market forms is undeniable — it exists because institutional traders create it, and we have the power to recognize it.
Some so-called economic experts may dismiss this approach as merely the “footprint of the market.” However, they fail to realize that recognizing these patterns is far more powerful than delving into complex economic analyses. Despite access to vast amounts of economic data, reading charts can provide a level of effectiveness that no amount of economic knowledge can match.

So, let’s delve deeper into this captivating world of true supply and demand. Prepare to be amazed by the insights that will revolutionize your trading game!
There will be moments when you come across patterns that could complete in different ways, and you might wonder if applying economic knowledge or keeping an eye on the news could help you predict the market’s direction. However, the real magic happens when you learn to read the chart accurately, interpreting its true meaning.
Time and again, you’ll notice that the market is a master of repetition, continuously presenting variations of familiar patterns. In the realm of supply and demand, some traders get caught up in terms like “institutional traders,” “retail traders,” “buying and selling,” and “order flow,” losing sight of the core essence — the market’s direction.

Don’t let your identity as a “retail trader” limit you. Whether you have a hundred or a million dollars in your account, your ability to perceive the known pattern can lead you to profitable trades. It’s not about being powerless against institutional traders; it’s about understanding the market’s behavior and making informed decisions.
So, here’s a challenge for you. Test it out and compare results. Seek guidance from a top economic expert for the next trade, and then get someone skilled in reading charts to do the same. Lastly, involve an expert in supply and demand trading methods. The outcome will surprise you — it won’t be a mere flip of a coin. Mastery of reading charts and recognizing true supply and demand patterns holds the key to profitable trading.
Are you up for the challenge? Embrace the art of pattern recognition and unlock the secrets that will elevate your trading game to new heights!
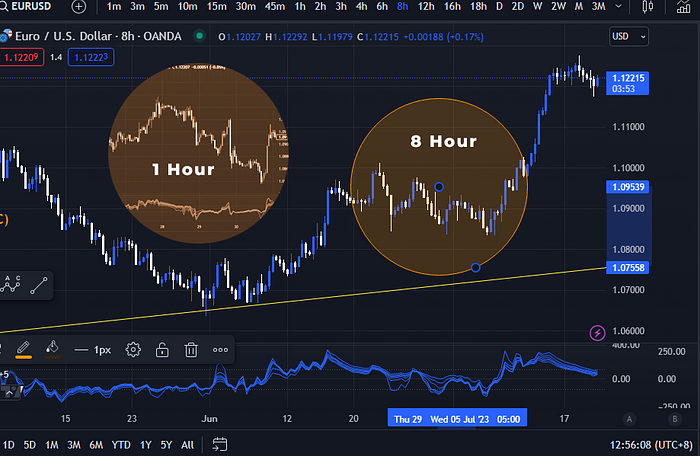
Alright, let’s dive further into the intriguing world of supply and demand trading. Often, mentors in this field present charts filled with great big boxes, making it tough to spot the real price action and intricate patterns. This limitation occurs when they focus on a specific time frame and draw zones based on one or two bearish candles. But the truth is, there’s a lot more to the story that remains hidden from view.
Imagine this — when you zoom in on a chart and observe just one bearish candle amidst an uptrend, it seems as though there’s nothing significant going on. But hold on! The real action is hidden within that candle, and the key lies in exploring shorter time frames. You see, they’ll teach you that you’re powerless, confined to a single time frame, and that’s why they call it “hidden supply” and “hidden demand.”
But let me debunk that myth right now. You have the power to switch to a different time frame and reveal the hidden treasures of supply and demand. A simple shift from the daily to the four-hour or one-hour chart can unveil perfect shapes of trends and corrections, allowing you to spot lucrative opportunities.
Why stay confined within the limitations of a single time frame when the entire world of trading beckons to you? You can explore and uncover the mysteries of corrections and trends, simply by adjusting your charts to different time frames. Witnessing the full picture will empower you to make informed and profitable decisions.
So, let’s break free from the shackles of a single time frame model and embrace the versatility of trading. The market holds an abundance of opportunities, waiting for you to uncover them. Get ready to see the world of supply and demand trading in a whole new light, and master the art of reading charts across multiple time frames!
Why would a trader want to avoid seeing a correction? Why might a training mentor discourage you from exploring corrections? Let’s unravel this mystery.
Within every trend, there are intricacies hidden, even on shorter time frames. Subdivisions of trends and corrections play out, with candles creating fascinating patterns. If you zoom in on shorter time frames, you’ll unveil more detail about these corrections — that’s just how the market works.
Here’s a crucial insight on effectively using supply and demand in trading: when you come across a trend with one or two bearish candles in an uptrend, or vice versa, the first thing to remember is that a correction is lurking there, albeit hidden from view. The key lies in venturing into shorter time frames to reveal the concealed truth.
Now, you might be familiar with my training approach, where I focus predominantly on longer and medium time frames, rather than indulging in short-term scalping. However, I place great importance on the ability to read charts effectively. No matter your chosen time frame, if you encounter one or two bearish candles, the logical move is to venture into a shorter time frame to grasp the bigger picture.
Why deprive yourself of the opportunity to witness corrections? Wouldn’t it be beneficial to explore shorter time frames to gain a more comprehensive understanding? Instead of relying on drawing zones from wick to body, let’s delve deeper and truly comprehend the significance of supply and demand trading.
The reason some advise against going to shorter time frames and exploring corrections is that they lack the knowledge and insight into identifying these essential elements of the market. But you don’t need to fall into that visual disadvantage. Embrace the power of exploring various time frames, and equip yourself with a profound understanding of corrections, trends, and the art of reading charts. Prepare to thrive in the dynamic world of trading!
Uptrend vs Correction
Let’s dive into a crucial aspect you shouldn’t miss when it comes to so-called supply and demand trading methods. Experts often label certain market movements as uptrends, but here’s the catch — they’re making a massive mistake!
Understanding the difference between an uptrend and a correction is essential. They are two completely distinct chart patterns, and mistaking one for the other can lead to costly errors. I’ve witnessed numerous “price action trading experts” showcasing examples of what they claim to be uptrends when, in reality, they are corrections moving upwards within a downtrend.
To navigate financial markets effectively, you must grasp the concept of trends and corrections. Trends represent impulsive movements, while corrections exhibit corrective patterns. Some may reference Elliott Wave theory, describing uptrends as a series of higher highs and higher lows, with waves that don’t overlap.
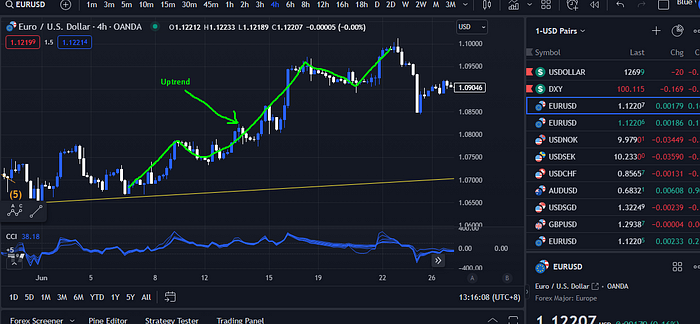
Avoid falling into the trap of misidentifying chart patterns. By honing your knowledge of trends and corrections, you’ll gain a valuable edge in the trading world. So let’s sharpen our understanding and unlock the mysteries of the market’s intricate movements!
Angle of Price Movement
Let’s take a closer look at what distinguishes an uptrend. Not only do the waves remain non-overlapping, but the shape and pattern itself take on a whole different dimension.
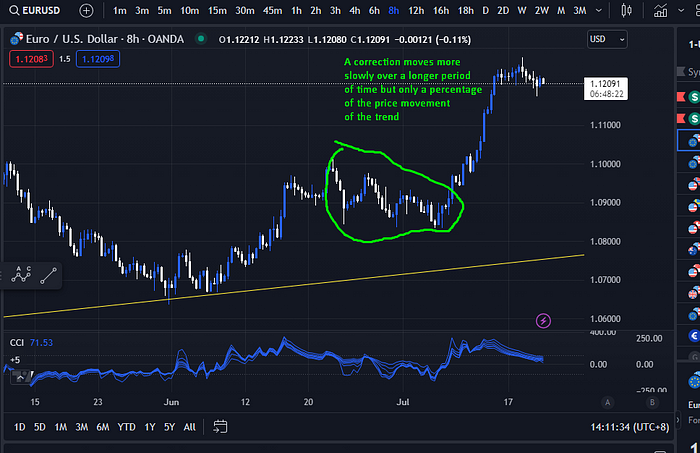
During an uptrend, the market exhibits rapid price movements over a short timeframe, leading to a steeper angle of ascent. However, as the trend reaches its peak, the angle starts to level out, and the movement becomes less steep. This change in angle signifies the transition from trend to correction. Once you grasp this fundamental insight, you’ll spot trends and corrections all around, regardless of whether they overlap or not.
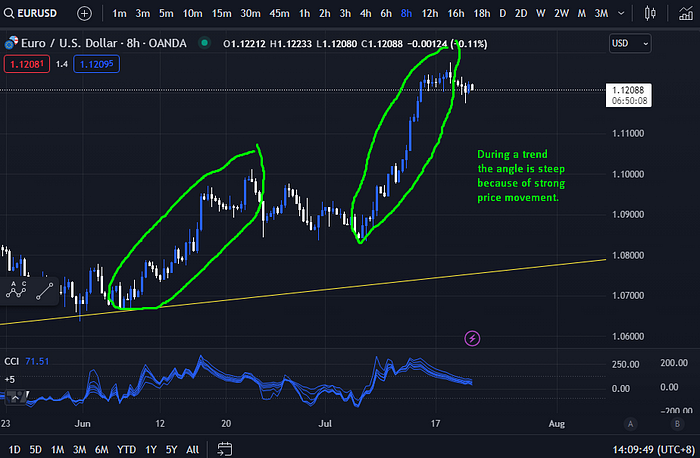
Picture this scenario: the market surges upwards, creating a powerful trend. However, as time goes on, it begins a correction phase, where the price movement covers only a percentage of the distance covered during the trend. Identifying this distinctive shift is key to piecing together the market’s puzzle and recognizing trends and corrections on any chart.
By mastering the art of identifying trend beginnings and endings, as well as correction ending points, you’ll gain a vital skill for successful trading. It’s no wonder that so many struggle in the trading world — without this knowledge, navigating the markets can be an uphill battle.
So, let’s delve into the heart of trading by understanding these critical concepts. By honing your skills in distinguishing trends and corrections, you’ll be well-equipped to conquer the complexities of the market and pave the way to profitable trades!
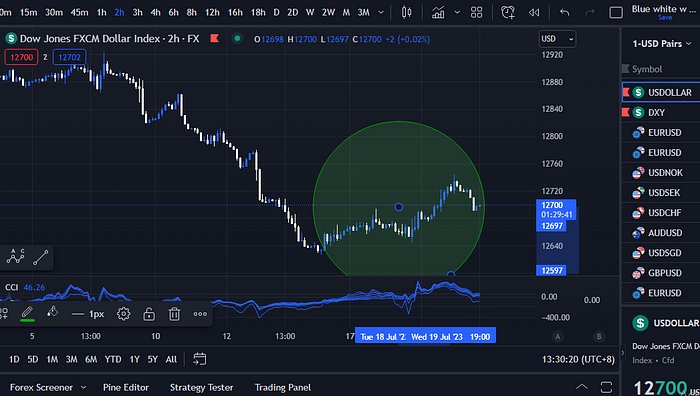
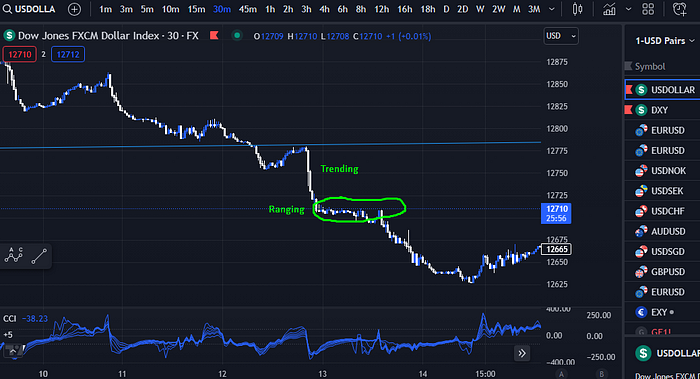
Trending Market vs Ranging Market?
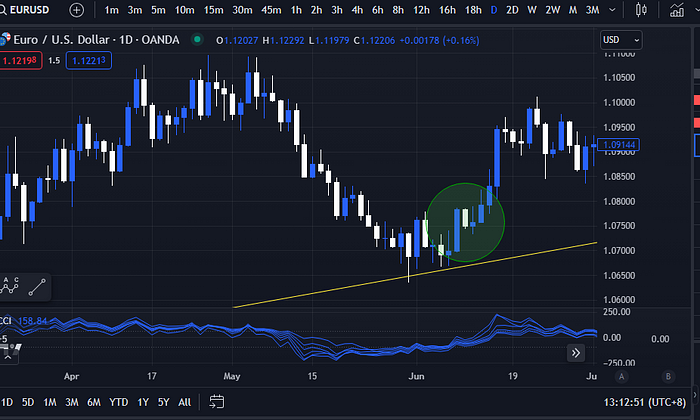
Supply and demand experts often categorize markets into two simple types: trending and ranging. But that’s merely scratching the surface of the complex price patterns and market conditions that truly shape the trading world. A ranging market is just one specific type of correction, where the market moves sideways. It’s essential to recognize this correction for what it is — a unique pattern in itself.
When a trend concludes, a typical correction begins, comprising three non-overlapping waves. Within these waves, you’ll find significant trends moving downward. Understanding these dynamics is crucial to deciding when and why to enter a trade, but if you’re oblivious to the existence and characteristics of corrections, you’d be at a loss.
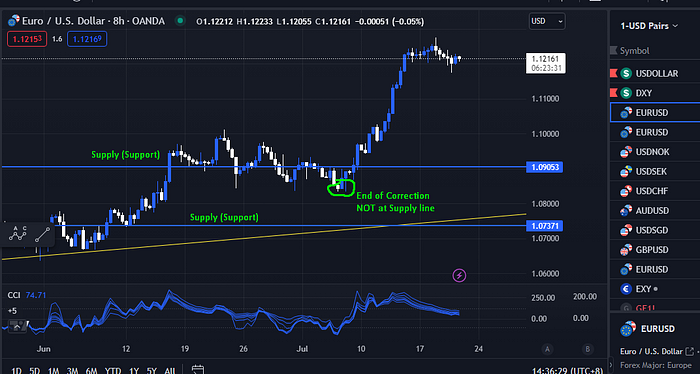
Drawing lines or zones based on previous turning points may seem like a sound strategy, as markets do occasionally turn at previous support or resistance levels. However, let me reveal an insightful truth: corrections, like the one shown here, rarely adhere to previous support. Even for corrections, marked as ABC, turning in the opposite direction of the trend, they consistently bypass previous support. It’s fascinating how these patterns remain consistent, isn’t it?
During trends, price completely disregards support and resistance. Similarly, during corrections, the price goes past without even flinching. While some turning points may align with previous support and resistance, it’s not the common pattern behavior, and certainly shouldn’t be the sole basis for your trading decisions or understanding the market’s direction.
So, let’s venture deeper into the intricacies of supply and demand trading. By comprehending these patterns and honing our skills, we can master the art of identifying the market’s true behavior and make informed, successful trades!
Why Supply and Demand Traders Project Imagined Intentions on the Market.
Alright, let’s delve into the fascinating world of trading and explore a more esoteric concept with the challenge that arises in the so-called “supply and demand trading method” — the projection of imagined intentions. This concept involves attaching personal beliefs to market movements, and it can significantly impact our trading decisions. Let me break it down for you.
When we observe the market, all we see is price — it fluctuates, rises, and falls. The key is to view these movements as a natural process, neither inherently good nor bad, unrelated to the intentions of imaginary traders on the other side of the market. We must humbly acknowledge that we don’t possess the ability to know their personal intentions.
The reality is, market movements result from the collective psychology of all traders involved. Whether they represent institutional traders or not, their aim is to achieve profits — and that’s perfectly normal. However, what can cloud a traders judgment is when people use specific trading terminology and project their moral intentions onto other traders.
It’s essential to recognize this phenomenon and avoid making assumptions about the intentions of fellow traders. By embracing a neutral perspective and focusing on the collective dynamics of the market, we can make better-informed trading decisions and navigate the complexities of supply and demand trading with greater clarity. So let’s free ourselves from the burden of projecting imagined intentions and embrace a more objective approach to trading!
Limiting Core Beliefs
Let’s unravel the fascinating world of trading psychology and explore a common stumbling block called “the projection of imagined intentions.” Many traders in the supply and demand trading method fall prey to limiting core beliefs, such as believing that “rich people are bad” or “making money is bad.” This leads to projecting imagined intentions onto the market movements, creating a sense of conflict within themselves.

It’s crucial to recognize that market movements are neither inherently good nor bad — they are simply price fluctuations. We should refrain from attributing moral intentions to other traders on the opposite side of the market. The truth is, successful trading involves seeking profit, which is a natural and acceptable goal.
However, some traders get caught up in a narrative of “evil institutional traders” thwarting the efforts of retail traders, causing self-sabotage and inner conflict. To break free from this cycle, we must change our limiting core beliefs. Mere thinking or reading won’t do the trick; we need specific methods to reprogram our subconscious beliefs.
By letting go of these negative projections and adopting a more balanced approach to trading, we can see the market as it truly is — a fluctuating entity offering profitable opportunities. Market movements are a result of supply and demand dynamics, and there’s no need to personify or vilify certain entities behind these movements.
Instead, we can focus on understanding the patterns and recognizing the opportunities to make profitable trades, just like institutional traders. Remember, there’s no need to harbor a moral judgment about market movements — both upward and downward movements present opportunities to capitalize on. Let’s drop the conflicts, learn to reprogram our subconscious beliefs, and embrace a more empowering and harmonious approach to trading.
While this aspect of trading may not be technical, it plays a pivotal role in the success of a trader. So, in addition to honing your chart analysis and supply and demand skills, invest time in understanding your core beliefs and subconscious programming for a well-rounded and fruitful trading journey.
Imagine the possibilities that await you if you’re truly dedicated to honing your trading skills. The live market is where the real action happens, and that’s precisely where we thrive during our live trading sessions. If you’re hungry for more knowledge and want to take your trading journey to the next level, look no further than our website, tradingmastermind.com.
Embark on your trading journey with our free professional trading course, carefully curated to help beginners like you get a solid start. Over 40 video lessons await, demonstrating the very strategies and techniques we’ve been discussing. You’ll learn how to trade effectively and find success in the market.
Don’t hold back — seize this opportunity to enhance your trading prowess. Head to our website, explore the resources we offer, and let us guide you towards a rewarding trading experience. Together, we’ll unlock the potential within you and unleash your trading mastery. Join us now and embark on a journey that promises growth, success, and fulfillment.
Watch the Complete Video Here: