
Today I’m going to show you even more explicitly and exactly, when to buy and when to sell trading Forex, crypto, or any other equity. Notice that if you ever put some time into learning how to trade, one of the things that you would discover is that there are vast differences of opinion about why you would enter a trade when you would enter a trade. As well as, why when would you exit a trade and why would you exit.
The differences can be extreme and our job is to find out what’s true about the behavior of financial market patterns. So how would we do that by looking at charts? And even though this is what I would always say, most people don’t believe that they can look at a chart and trade based on seeing the shapes and patterns on the chart, and because they don’t believe it, it’s just blocked out of their mind.
It’s known that traders trade their beliefs. This is why it’s so important to learn how to program your beliefs. I can show you that it’s true that most people don’t believe that they can trade based on seeing the charts, but they believe that in order to trade they would need to have some mathematics. They would need to have some algorithms. They would need to have some software or some kind of an indicator.

People tend to look at lines of horizontal or diagonal lines and that’s how you trade. They don’t know that you could trade based on seeing the actual shape of the patterns. Because they don’t believe that, it’s just blocked out of their mind.
You can see how dramatic people’s beliefs are in such things as when you watch an NLP master like Darren Brown, demonstrate how a person who used to know the color of their car, now they can’t recognize the color of their car because of something that happened inside their mind according to their beliefs about the color.

Once you see that demonstrated you can recognize that what people believe is very important. So if you don’t believe that you can trade based on the visual recognition of the shapes that are on the charts, you will block it out of your mind.
Now let’s take a look at what markets actually do and you’ll see this is scientifically true. What’s true about markets and what do they actually do? Is there something that can be known and seen to be true? Something that can visually be recognized? Something that would tell us if the market is turning, or if it’s going to continue? Well this can be proven by the fact that it’s recorded on your charts and on all charts. So once you can see it, then you would say, “This is true!”
Because you can see it on all charts and you can test it. You can see it in forward testing results and back testing. This has been doing this phenomenon virtually forever.
One of the first recognitions that a person needs to have is that in financial markets, there is clearly recognizable impulsive price action followed by corrective price action. If you don’t know that, if you haven’t seen it, I can help you to see it on charts. It’s on every chart. So once you have this realization then you would realize that if you could enter at the end of a correction or if you knew how to identify the end of a trend (try not to block it out of your mind. See it on the chart) you would be able to see that you could get high probability in your trading. Know when you could enter and you could exit.
So the bottom line is, when would you enter a trade? Consider entering right at the end of a correction and be able to identify that. When would you exit a trade? Right at the end of a trend and make sure that you know how you would be able to identify that. And how you would be able to identify that a trend has not ended? How could you identify that a correction has not ended? Is there a specific point that you could learn to recognize?
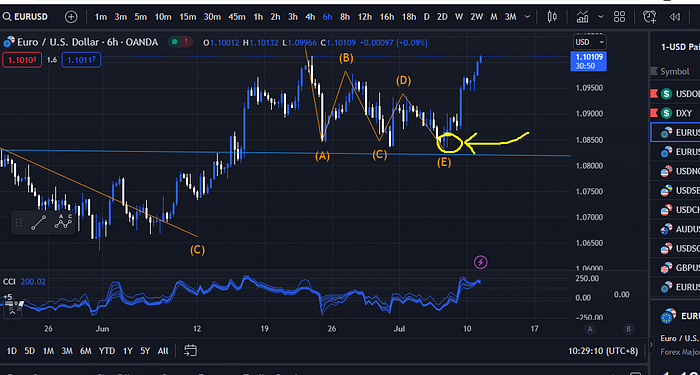
So notice when you look at this picture right here on this chart, this is another perfect example of the classic shape of a trend. I show this all the time and people say, “I don’t know what a recognizable — what are you talking about? But if you know what the letter ”a” is or the letter “b” is, then how would you not be able to see this shape right here? You would. You’d have to be able to see it unless you blocked it out. So if you’re not blocking it out you must be able to see that. And that is a classic shape that trends commonly make.
This is a classic perfect shape of an ABC correction. A “B” one two three four five of C turning at 61.8 percent. Could you recognize that just one time? Did it form that just one time or does it do it all the time? Could this be something that you could recognize visually on a chart? If you could do that you could get a lot of profit and have high probability. It’s something right on the chart and you can see it. You don’t need something to tell you about that. You see it. And that’s what people don’t want because it’s believed that information is forbidden. You’re not authorized to see these things. In fact, a lot of people believe, “Only banks can see that.” “Only a bank can see that.” or “Only banks can trade in a way that can get profit. A regular person couldn’t do that.” That’s the limiting belief that causes people to block it out of their mind.
A lot of people would look at this and they would say, “I tried that Elliott Wave stuff that stuff doesn’t work.” If you hear that, you know that you’re talking to someone who is blind. They are ignorant. Consequently, it’s excellent when I hear people say that Elliott Wave doesn’t work. Because then I know this person is blind and they’re ignorant. Because I see it on charts and I know what’s on there. You could say, “No that’s not on there.” I’ll still know that. It’s on there. So if you are that insecure that you if someone tells you it’s not on there you just go, “Okay that’s not on there.” If you can see it, it’s on there. And if you’re confident that you’re able to see things yourself, you don’t need anyone’s opinion. You don’t need anyone’s approval for you to see that.
Some people would say “No. There’s no Elliott Wave on there. That’s Wolf Wave.”
Or, “No. There’s no Elliott Wave that’s chaos theory.”
“No there’s no Elliott Wave. That’s a harmonic pattern right there.
“There’s no Elliott Wave on that chart. That’s the Shubert wave. You know what? It doesn’t matter what the hell you call it. It’s still doing the same thing.
So if it’s not making an Elliott wave pattern, show me what it is making. I know what it’s making and I see it. If you say it’s not making Elliott Wave you’re blind. That’s what’s so important. A few people in the world can have enough confidence that they can see things on charts and trade as a result of it. And it doesn’t matter what you call it, it’s still doing the same thing.
So if you can trade it’s because you see what the market is doing. If it’s not making Elliott Wave patterns, show me what it is making and trade based on that.
Now what some people might discover is they could look at that and say, “ Well I do see some patterns, but there are places where I don’t see patterns, or maybe the patterns don’t make sense.” And if that were the case, you’ve made a major breakthrough and you’re ready for the next step. The next step is that there are additional steps. So if you just happen to pull up one chart of one currency pair on a random time frame that you chose and you don’t see a perfect chart in a series of nothing but clear patterns, there are additional steps to open it up so you can see more of it and get more out of the pictures.
So that you can read it like a road map and trade based on what you know to be true. If this is fascinating to you and you’d like to see how this is done, just join us in our live sessions every day. This is exactly what we’ll do is we’ll be identifying the end of a trend and the end of a correction. You’ll be able to see it. And the only result would be that your skill would have to improve and refine more and more. So your probability would go up and up.
Watch the full video here: